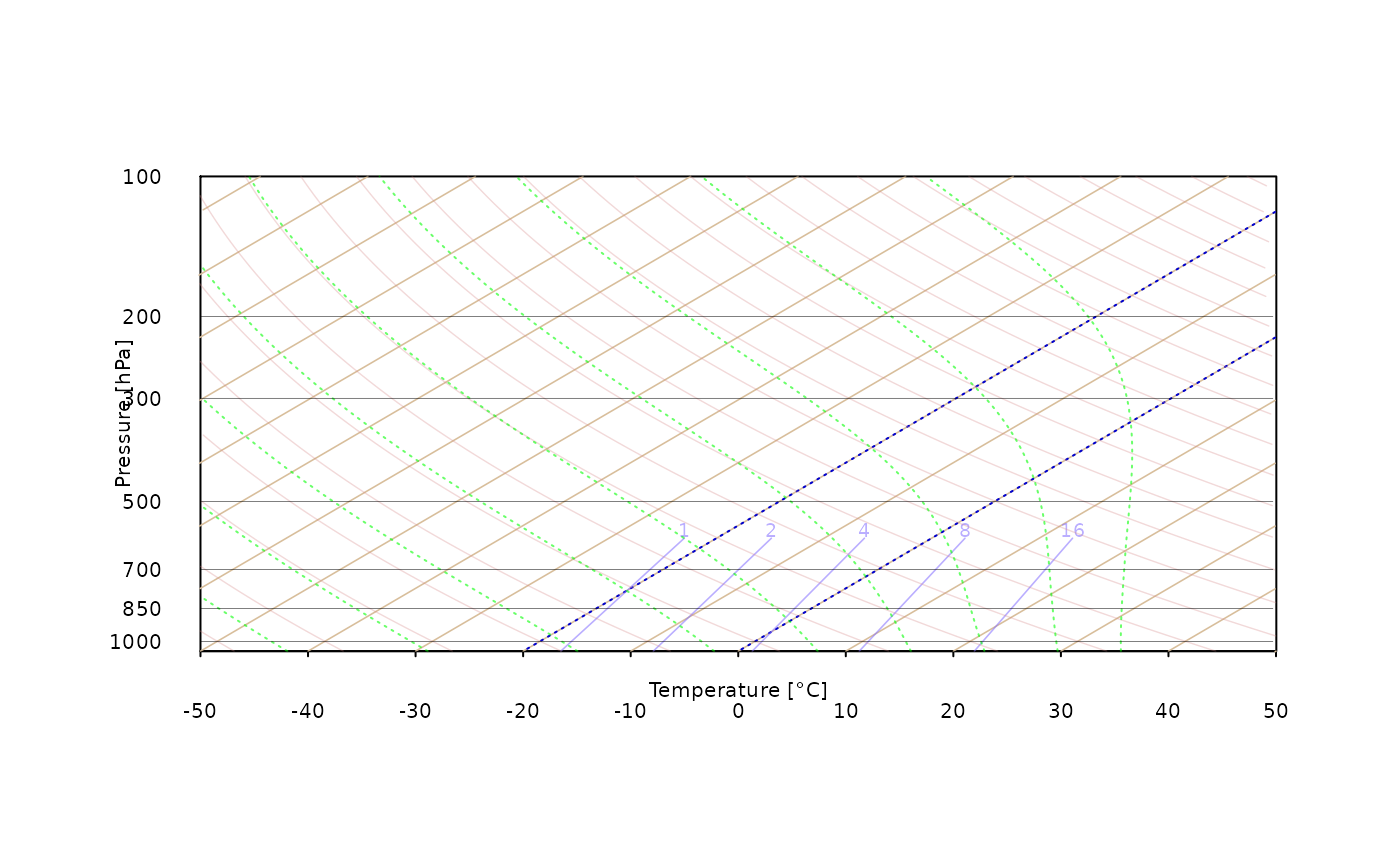
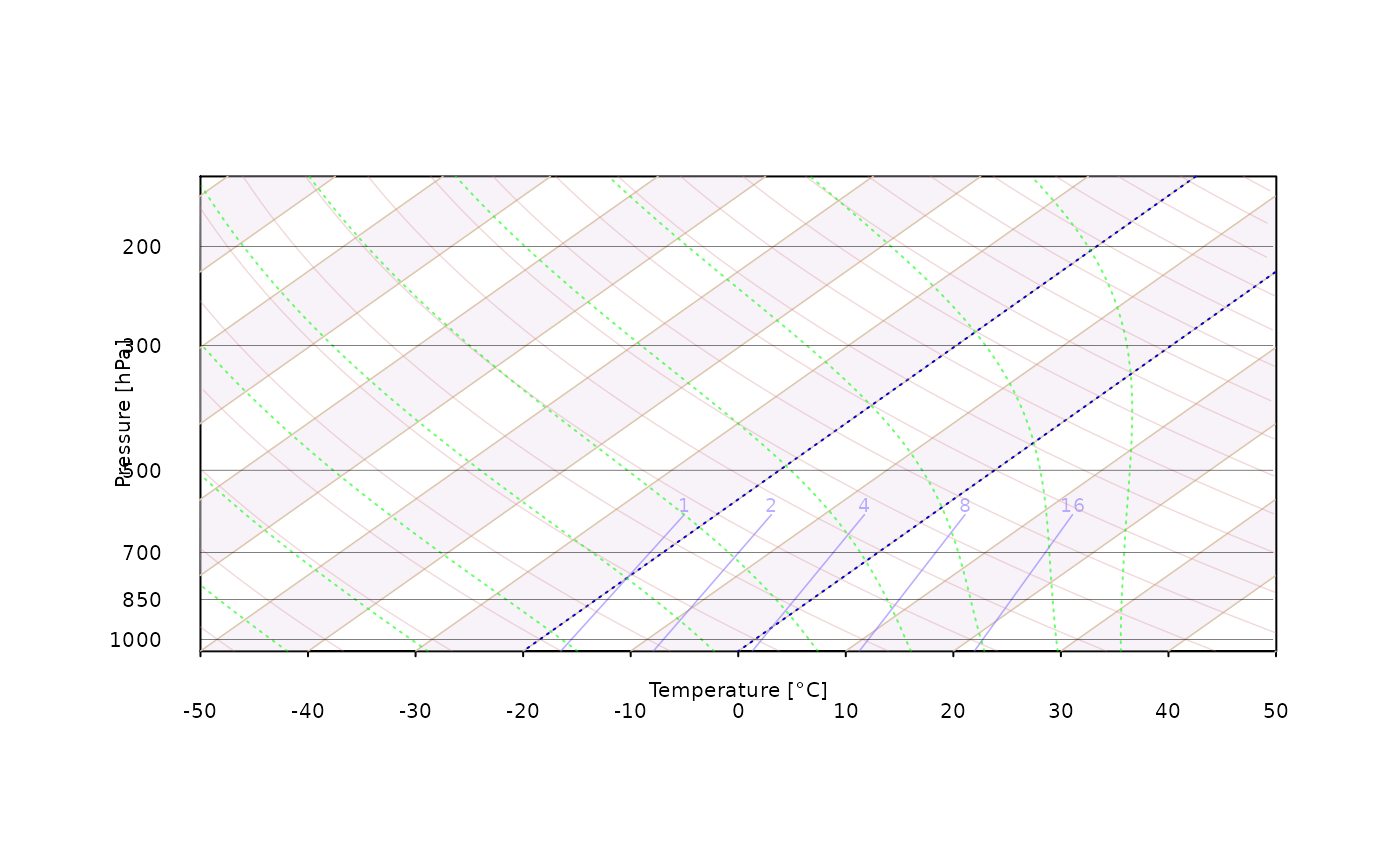
Function for plotting a customized version of the Skew-T diagram. Please note that drawing Skew-T may require increasing size or modifying aspect ratio of plotting window in order to provide readable results.
skewt_plot(
  ptop = 100,
  isoterms_col = "#d8be9b",
  temp_stripes = FALSE,
  mixing_ratio_col = "#8470FF90",
  dry_adiabats_col = "#d6878750",
  moist_adiabats_col = "#00FF0095",
  deg45 = FALSE,
  isotherm0 = TRUE,
  close_par = TRUE,
  ...
)
Arguments
- ptop
Pressure top level to be used for plotting diagram. Valid options: 200, 150, 100 (default) and 50 hPa
- isoterms_col
color to be used for drawing dry isoterms
- temp_stripes
logical, whether to draw color stripes for isotherms
- mixing_ratio_col
color to be used for drawing mixing ratio isolines and labels. If set to NA or empty string isolines are not drawn
- dry_adiabats_col
color to be used for drawing dry adiabats. If set to NA or not provided drawing lines skipped
- moist_adiabats_col
color to be used for drawing moist adiabats. If set to NA or not provided drawing lines skipped
- deg45
whether to preserve 45 degrees for diagonal isolines on Skew-T diagram regardless ploting window aspect ratio. [logical, default: FALSE]
- isotherm0
whether to deliminate 0 degree Celsius isother [logical, default: TRUE]
- close_par
if plot will be modified in next steps storing par settings is needed. This logical argument is turned on by default. If you want to modify Skew-T plot in next step set it to FALSE
- ...
additional (mostly graphical) parameters to be passed
Value
Draws a Skew-T log-p diagram
Examples
skewt_plot(ptop = 100)


skewt_plot(ptop = 150, temp_stripes = TRUE) # add color stripes for temperature


skewt_plot(ptop = 100, close_par = FALSE)
title("Your title")
mtext('WMO ID: 11035, 2011-08-23 1200 UTC', padj = -0.5, col = "white")
data("sounding_vienna")
attach(sounding_vienna)
#> The following objects are masked from sounding_vienna (pos = 3):
#>
#>     altitude, dpt, pressure, temp, wd, ws
#> The following object is masked from package:datasets:
#>
#>     pressure

output = sounding_export(pressure, altitude, temp, dpt, wd, ws)
skewt_lines(output$dpt, output$pressure,type='l',col='forestgreen',lwd = 2.5)
skewt_lines(output$temp,output$pressure,type='l',col='red', lwd = 2.5)
skewt_lines(output$MU,output$pressure, col = "orange", lty = 1, lwd = 2)
skewt_lines(output$tempV,output$pressure, col = "red3", lty = 3, lwd = 1.5)
