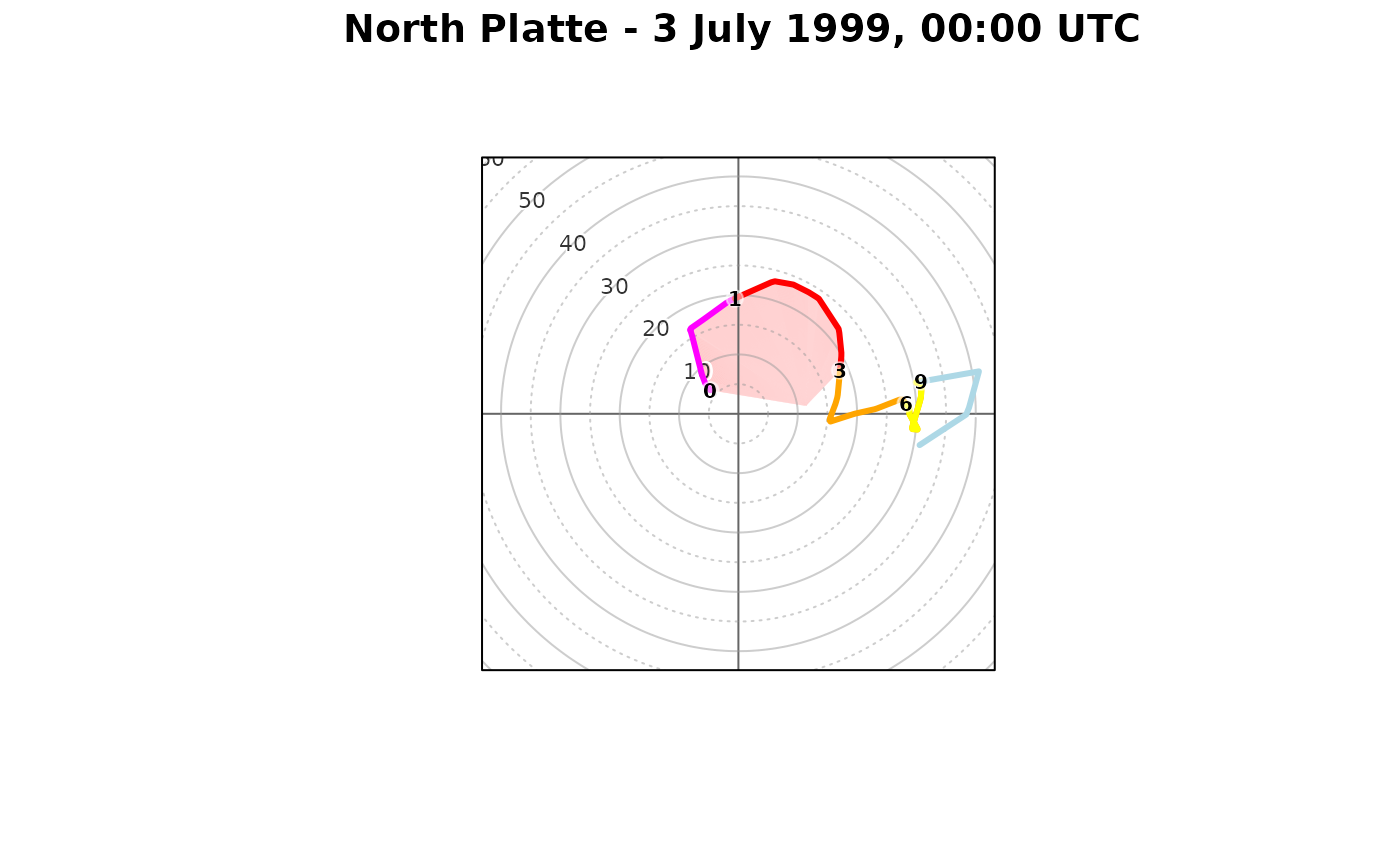
Plot hodograph to show changes in wind speed and wind direction with height
Arguments
- ws
wind speed [knots]
- wd
wind direction [azimuth in degrees]
- altitude
altitude [m] (can be above sea level or above ground level as function always consider first level as surface, i.e h = 0 m) altitude [m]
- max_hght
maximum altitude [km] to be considered on the hodograph, 12 km used by default
- max_speed
displayed range of the drawn hodograph [m/s], 25 m/s used as default
- lab_hghts
height labels [km] to be drawn on the hodograph, 0, 1, 3, 6, 9, 12 used by default; NULL for skipping labels
- close_par
if plot will be modified in next steps storing par settings is needed. This logical argument is turned on by default. If you want to modify Skew-T plot in next step set it to FALSE
- SRH_polygon
draws polygon for storm-relative helicity, available options are "0500m", "01km", "03km", "36km", "none", "03km" used as default
- storm_motion
(optional) for moving storms only - one can define wind speed [m/s] and wind directions [degrees] that will be used to compute adjusted SRH parameters
- ...
other graphical parameters to be used with plot() function
Value
hodograph plot