
The goal of the climate R package is to automatize downloading of in-situ meteorological and hydrological data from publicly available repositories:
- OGIMET (ogimet.com) - up-to-date collection of SYNOP dataset
- University of Wyoming - atmospheric vertical profiling data (http://weather.uwyo.edu/upperair/)
- National Oceanic & Atmospheric Administration - Earth System Research Laboratories - Global Monitoring Laboratory (NOAA)
- Polish Institute of Meteorology and Water Management - National Research Institute (IMGW-PIB)
- National Centers for Environmental Information, National Oceanic & Atmospheric Administration - National Climatic Data Center - Integrated Surface Hourly (ISH) (NOAA)
Installation
The stable release of the climate package from the CRAN repository can be installed with:
install.packages("climate")It is also possible to install the most up-to-date development version of climate from GitHub with:
Overview
Meteorological data
🌍 meteo_ogimet - Downloading hourly and daily meteorological data from the SYNOP stations available in the ogimet.com collection. Any meteorological (aka SYNOP) station working under the World Meteorological Organization framework after year 2000 should be accessible. Two backends are available and selected automatically: raw SYNOP decoding (
source = "synop", default forinterval = "hourly") and HTML scraping (source = "html", default forinterval = "daily"). Country-level bulk downloads are supported via thecountry_nameargument (SYNOP backend only).🌍 meteo_noaa_hourly - Downloading hourly NCEI/NOAA Integrated Surface Hourly (ISH) meteorological data - Some stations have > 100 years long history of observations
🌍 meteo_noaa_co2 - Downloading monthly CO2 measurements from Mauna Loa Observatory
🌍 sounding_wyoming - Downloading measurements of the vertical profile of atmosphere (aka rawinsonde data)
🇵🇱 meteo_imgw - Downloading hourly, daily, and monthly meteorological data from the Polish met service across all types of stations (i.e. SYNOP/CLIMATE/PRECIP ) available in the danepubliczne.imgw.pl collection. It is a wrapper for
meteo_monthly(),meteo_daily(),meteo_hourly()andmeteo_imgw_datastore()which gives access from montly to even to 10-min dataset. IMGW archive outputs use short English parameter names; the original IMGW names are available aslabelattributes on the corresponding columns.
(Polish) Hydrological data
🇵🇱 hydro_imgw - Downloading hourly, daily, and monthly hydrological data from stations available in the danepubliczne.imgw.pl collection. It is a wrapper for previously developed set of functions such as:
hydro_monthly(), andhydro_daily()IMGW archive outputs use short English parameter names; the original IMGW names are available aslabelattributes on the corresponding columns.🇵🇱 hydro_imgw_datastore - Downloading hourly and subhourly hydrological data from the IMGW-PIB hydro telemetry stations.
Auxiliary functions and datasets
🌍 stations_ogimet - Downloading information about all stations available in the selected country in the Ogimet repository
🌍 nearest_stations_ogimet - Downloading information about nearest stations to the selected point using Ogimet repository
🌍 nearest_stations_noaa - Downloading information about nearest stations to the selected point available for the selected country in the NOAA ISH meteorological repository
🇵🇱 nearest_stations_imgw - List of nearby meteorological or hydrological IMGW-PIB stations in Poland
🇵🇱 imgw_meteo_stations - Built-in metadata from the IMGW-PIB repository for meteorological stations, their geographical coordinates, and ID numbers
🇵🇱 imgw_hydro_stations - as above, for hydrological stations
🇵🇱 stations_meteo_imgw_telemetry - Downloading complete and up-to-date information about coordinates for IMGW-PIB telemetry meteorological stations
🇵🇱 stations_hydro_imgw_telemetry - Downloading complete and up-to-date information about coordinates for IMGW-PIB telemetry hydrological stations
🌍 synop_parser - Decoding raw SYNOP meteorological messages into structured R lists or data frames. For a full walkthrough see the SYNOP Messages vignette.
Example 1
Download hourly dataset from NCEI/NOAA ISH meteorological repository:
library(climate)
noaa = meteo_noaa_hourly(station = "123300-99999", year = 2018:2019) # station ID: Poznan, Poland
head(noaa)| year | month | day | hour | lon | lat | alt | t2m | dpt2m | ws | wd | slp | visibility |
|---|---|---|---|---|---|---|---|---|---|---|---|---|
| 2019 | 1 | 1 | 0 | 16.85 | 52.417 | 84 | 3.3 | 2.3 | 5 | 220 | 1025.0 | 6000 |
| 2019 | 1 | 1 | 1 | 16.85 | 52.417 | 84 | 3.7 | 3.0 | 4 | 220 | 1024.2 | 1500 |
| 2019 | 1 | 1 | 2 | 16.85 | 52.417 | 84 | 4.2 | 3.6 | 4 | 220 | 1022.5 | 1300 |
| 2019 | 1 | 1 | 3 | 16.85 | 52.417 | 84 | 5.2 | 4.6 | 5 | 240 | 1021.2 | 1900 |
Example 2
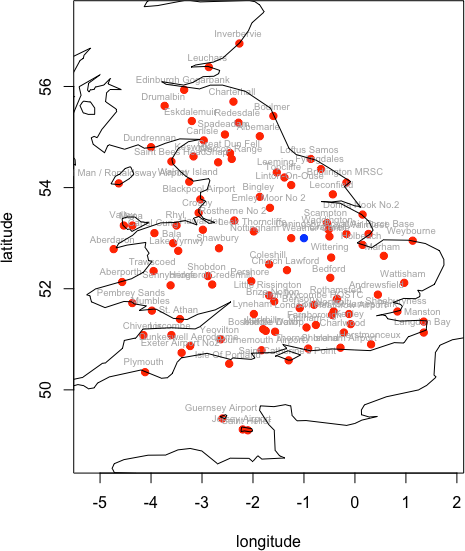
Finding a nearest meteorological stations in a given country using NCEI/NOAA ISH data source (used in Ex. 1):
# find 100 nearest UK stations to longitude 1W and latitude 53N :

nearest_stations_ogimet(country = "United Kingdom",
  date = Sys.Date(),
  add_map = TRUE,
  point = c(-1, 53),
  no_of_stations = 100
)| wmo_id | station_names | lon | lat | alt | distance [km] |
|---|---|---|---|---|---|
| 03354 | Nottingham Weather Centre | -1.250005 | 53.00000 | 117 | 28.04973 |
| 03379 | Cranwell | -0.500010 | 53.03333 | 67 | 56.22175 |
| 03377 | Waddington | -0.516677 | 53.16667 | 68 | 57.36093 |
| 03373 | Scampton | -0.550011 | 53.30001 | 57 | 60.67897 |
| 03462 | Wittering | -0.466676 | 52.61668 | 84 | 73.68934 |
| 03544 | Church Lawford | -1.333340 | 52.36667 | 107 | 80.29844 |
| … | … | … | … | … | … |
Example 3
Downloading daily (or hourly) data from a global (OGIMET) repository knowing its ID (see also nearest_stations_ogimet()):
# Daily summary — uses HTML backend by default
o = meteo_ogimet(date = c(Sys.Date() - 5, Sys.Date() - 1),
                 interval = "daily",
                 station = 12330)
head(o)| station_ID | Date | TempCAvg | TempCMax | TempCMin | TdAvgC | HrAvg | WindDir | WindInt | WindGust | PressHp | Precmm | TotClOct | lowClOct | SunD1h | VisKm |
|---|---|---|---|---|---|---|---|---|---|---|---|---|---|---|---|
| 12330 | 2019-12-21 | 8.8 | 13.2 | 4.9 | 5.3 | 79.3 | SSE | 11.4 | 39.6 | 995.9 | 1.8 | 3.6 | 2.0 | 6.7 | 21.4 |
| 12330 | 2019-12-20 | 5.4 | 8.5 | -1.2 | 4.5 | 92.4 | ESE | 15.0 | NA | 1015.0 | 0.0 | 6.4 | 0.6 | 1.0 | 8.0 |
| 12330 | 2019-12-19 | 3.8 | 10.3 | -3.0 | 1.9 | 89.6 | SW | 7.1 | NA | 1020.4 | 0.0 | 5.2 | 5.9 | 2.5 | 14.1 |
| 12330 | 2019-12-18 | 6.3 | 9.0 | 2.2 | 4.1 | 84.8 | S | 9.2 | NA | 1009.2 | 0.0 | 5.7 | 2.7 | 1.4 | 12.2 |
| 12330 | 2019-12-17 | 4.9 | 7.6 | 0.3 | 2.9 | 87.2 | SSE | 7.2 | NA | 1010.8 | 0.1 | 6.2 | 4.6 | NA | 13.0 |
# Hourly observations — decoded from raw SYNOP messages by default
h = meteo_ogimet(date = c("2009-12-01", "2009-12-04"),
                 interval = "hourly",
                 station  = 12330)
head(h)| date | station | t2m | dpt2m | rel_hum | tmax | tmin | wd | ws | gust | press | slp | precip | Nt | snow |
|---|---|---|---|---|---|---|---|---|---|---|---|---|---|---|
| 2009-12-01 00:00:00 | 12330 | 2.0 | 0.0 | 93 | NA | NA | 210 | 5 | NA | 1007.4 | 1016.3 | NA | 8 | NA |
| 2009-12-01 06:00:00 | 12330 | 1.0 | -1.0 | 92 | NA | NA | 200 | 3 | NA | 1009.8 | 1018.8 | NA | 8 | NA |
| 2009-12-01 12:00:00 | 12330 | 3.0 | 1.0 | 93 | 5.8 | 2.9 | 230 | 4 | NA | 1011.5 | 1020.4 | NA | 8 | NA |
| 2009-12-01 18:00:00 | 12330 | 2.0 | 0.0 | 93 | NA | NA | 240 | 3 | NA | 1013.3 | 1022.1 | NA | 7 | NA |
# Country-level bulk download — all stations in a country for a given day
poland = meteo_ogimet(interval      = "hourly",
                      country_name  = "Poland",
                      date          = c("2009-12-15", "2009-12-15"))
nrow(poland)  #> several hundred rows (one per observation per station)
Example 4
Downloading monthly/daily/hourly meteorological/hydrological data from the Polish (IMGW-PIB) repository:
m = meteo_imgw(interval = "monthly", rank = "synop", year = 2000, coords = TRUE)
head(m)| rank | id | X | Y | station | yy | mm | tmax_abs | tmax_mean | tmin_abs | tmin_mean | t2m_mean_mon | t5cm_min | rr_monthly |
|---|---|---|---|---|---|---|---|---|---|---|---|---|---|
| SYNOP | 353230295 | 23.16228 | 53.10726 | BIAŁYSTOK | 2000 | 1 | 5.3 | 0.4 | -16.5 | -4.5 | -2.1 | -23.5 | 34.2 |
| SYNOP | 353230295 | 23.16228 | 53.10726 | BIAŁYSTOK | 2000 | 2 | 10.6 | 4.1 | -10.4 | -1.4 | 1.3 | -12.9 | 25.4 |
| SYNOP | 353230295 | 23.16228 | 53.10726 | BIAŁYSTOK | 2000 | 3 | 14.8 | 6.2 | -6.4 | -1.0 | 2.4 | -9.4 | 45.5 |
| SYNOP | 353230295 | 23.16228 | 53.10726 | BIAŁYSTOK | 2000 | 4 | 27.8 | 17.9 | -4.6 | 4.7 | 11.5 | -8.1 | 31.6 |
| SYNOP | 353230295 | 23.16228 | 53.10726 | BIAŁYSTOK | 2000 | 5 | 29.3 | 21.3 | -4.3 | 5.7 | 13.8 | -8.3 | 9.4 |
| SYNOP | 353230295 | 23.16228 | 53.10726 | BIAŁYSTOK | 2000 | 6 | 32.6 | 23.1 | 1.0 | 9.6 | 16.6 | -1.8 | 36.4 |
h = hydro_imgw(interval = "daily", year = 2010:2011)
head(h)| id | station | riv_or_lake | Data | hyy | idhyy | dd | H | Q | T | mm | thick |
|---|---|---|---|---|---|---|---|---|---|---|---|
| 150210180 | ANNOPOL | Wisła (2) | 2009-11-01 | 2010 | 1 | 1 | 287 | 436 | NA | 11 | NA |
| 150210180 | ANNOPOL | Wisła (2) | 2009-11-02 | 2010 | 1 | 2 | 282 | 412 | NA | 11 | NA |
| 150210180 | ANNOPOL | Wisła (2) | 2009-11-03 | 2010 | 1 | 3 | 272 | 368 | NA | 11 | NA |
| 150210180 | ANNOPOL | Wisła (2) | 2009-11-04 | 2010 | 1 | 4 | 268 | 352 | NA | 11 | NA |
| 150210180 | ANNOPOL | Wisła (2) | 2009-11-05 | 2010 | 1 | 5 | 264 | 336 | NA | 11 | NA |
| 150210180 | ANNOPOL | Wisła (2) | 2009-11-06 | 2010 | 1 | 6 | 260 | 320 | NA | 11 | NA |
The original IMGW description of H can be inspected with attr(h$H, "label").
Example 5
Create Walter & Lieth climatic diagram based on downloaded data
library(climate)
library(dplyr)

df = meteo_imgw(interval = "monthly", rank = "synop", year = 1991:2019, station = "POZNAŃ")
df2 = select(df, station:t2m_mean_mon, rr_monthly)

monthly_summary = df2 %>%
  group_by(mm) %>%
  summarise(tmax = mean(tmax_abs, na.rm = TRUE),
            tmin = mean(tmin_abs, na.rm = TRUE),
            tavg = mean(t2m_mean_mon, na.rm = TRUE),
            prec = sum(rr_monthly) / n_distinct(yy))

monthly_summary = as.data.frame(t(monthly_summary[, c(5,2,3,4)]))
monthly_summary = round(monthly_summary, 1)
colnames(monthly_summary) = month.abb
print(monthly_summary)| Jan | Feb | Mar | Apr | May | Jun | Jul | Aug | Sep | Oct | Nov | Dec | |
|---|---|---|---|---|---|---|---|---|---|---|---|---|
| prec | 37.1 | 31.3 | 38.5 | 31.3 | 53.9 | 60.8 | 94.8 | 59.6 | 40.5 | 39.7 | 35.7 | 38.6 |
| tmax | 8.7 | 11.2 | 17.2 | 23.8 | 28.3 | 31.6 | 32.3 | 31.8 | 26.9 | 21.3 | 14.3 | 9.8 |
| tmin | -15.0 | -11.9 | -7.6 | -3.3 | 1.0 | 5.8 | 8.9 | 7.5 | 2.7 | -2.4 | -5.2 | -10.4 |
| tavg | -1.0 | 0.5 | 3.7 | 9.4 | 14.4 | 17.4 | 19.4 | 19.0 | 14.3 | 9.1 | 4.5 | 0.8 |
# create plot with use of the "climatol" package:
climatol::diagwl(monthly_summary, mlab = "en",
                 est = "POZNAŃ", alt = NA,
                 per = "1991-2019", p3line = FALSE)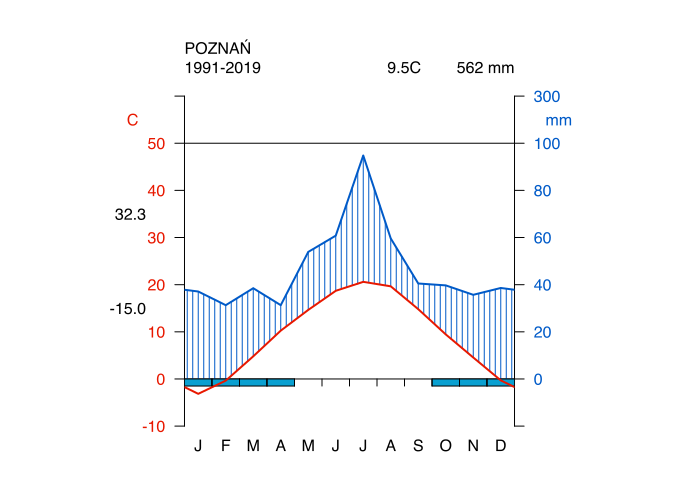
Example 6
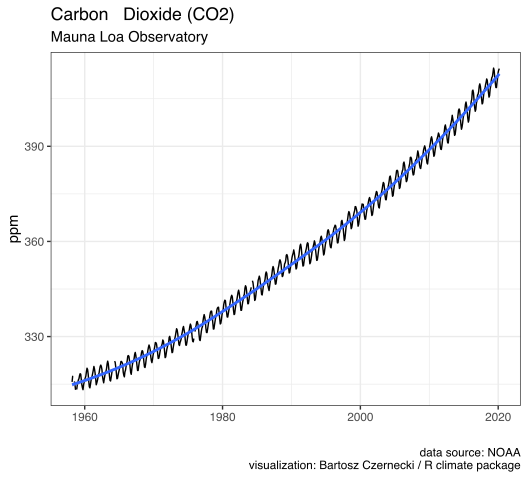
Download monthly CO2 dataset from Mauna Loa observatory
library(climate)
library(ggplot2)
library(ggthemes)

co2 = meteo_noaa_co2()
head(co2)
co2$date = ISOdate(co2$yy, co2$mm, 1)
ggplot(co2, aes(date, co2_avg)) +
  geom_line()+ geom_smooth()+
  theme_bw()+
  labs(
    title = "Carbon Dioxide (CO2)",
    subtitle = paste0("Mauna Loa Observatory "),
    caption = "data source: NOAA
    visualization: Bartosz Czernecki / R climate package",
    x = "",
    y = "ppm"
)
Example 7
Use “climate” inside python environment via rpy2
# load required packages
from rpy2.robjects.packages import importr
import rpy2.robjects as robjects
import pandas as pd
import datetime as dt

# load climate package (make sure that it was installed in R before)
importr("climate")
# test functionality e.g. with meteo_ogimet function for New York - La Guardia:
df = robjects.r["meteo_ogimet"](interval = "daily", station = 72503,
                                date = robjects.StrVector(["2022-05-01", "2022-06-15"]))
# optionally - transform object to pandas data frame and rename columns + fix datetime:
res = pd.DataFrame(df).transpose()
res.columns = df.colnames
res["Date"] = pd.TimedeltaIndex(res["Date"], unit="d") + dt.datetime(1970,1,1)
res.head

>>> res[res.columns[0:7]].head()| station_ID | Date | TemperatureCAvg | TemperatureCMin | TdAvgC | HrAvg |
|---|---|---|---|---|---|
| 72503.0 | 2022-06-15 | 23.5 | 19.4 | 10.9 | 45.2 |
| 72503.0 | 2022-06-14 | 25.0 | 20.6 | 16.1 | 59.0 |
| 72503.0 | 2022-06-13 | 20.4 | 17.8 | 16.0 | 74.8 |
| 72503.0 | 2022-06-12 | 21.3 | 18.3 | 12.0 | 57.1 |
| 72503.0 | 2022-06-11 | 22.6 | 17.8 | 8.1 | 40.1 |
Example 8
Decode raw SYNOP messages with synop_parser()
The synop_parser() function decodes FM-12 SYNOP meteorological messages into structured R objects. For a detailed guide including all parameters and output formats, see the SYNOP Messages vignette.
library(climate)

synop_code = "AAXX 01004 88889 12782 61506 10094 20047 30111 40197 53007 60001 81541"

# Decode a single message — returns a named list
result = parser(synop_code)
result$station_id$value        #> "88889"
result$air_temperature$value   #> 9.4
result$wind_speed$value        #> 6
result$visibility$value        #> 40000
result$sea_level_pressure$value #> 1019.7
# Return a tidy data frame with one row per message
df = parser(synop_code, as_data_frame = TRUE)
df| station_type | station_id | region | obs_day | obs_hour | wind_unit | wind_estimated | visibility | cloud_cover | wind_direction | wind_speed | air_temperature | dewpoint_temperature |
|---|---|---|---|---|---|---|---|---|---|---|---|---|
| AAXX | 88889 | III | 1 | 0 | KT | FALSE | 40000 | 6 | 150 | 6 | 9.4 | 4.7 |
| station_pressure | sea_level_pressure | pressure_tendency | pressure_change | precipitation_amount | precipitation_time | cloud_base_min | cloud_base_max | low_cloud_type | middle_cloud_type | high_cloud_type | low_cloud_amount | source |
|---|---|---|---|---|---|---|---|---|---|---|---|---|
| 1011.1 | 1019.7 | 0 | 7 | 0 | 6 | 1500 | 2000 | 5 | 4 | 1 | 1 | AAXX 01004 88889 12782… |
# Decode multiple SYNOP messages at once
msgs = c(
  "AAXX 01004 88889 12782 61506 10094 20047 30111 40197 53007 60001 81541",
  "AAXX 10124 26477 32560 83102 10156 20106 38528 40128 52003 60001 333 56017"
)
df2 = parser(msgs, as_data_frame = TRUE)
nrow(df2)       #> 2
df2$station_id  #> c("88889", "26477")
df2$source      # original SYNOP strings preserved in last column
Acknowledgment
Ogimet.com, University of Wyoming, and Institute of Meteorology and Water Management - National Research Institute (IMGW-PIB), National Oceanic & Atmospheric Administration (NOAA) - Earth System Research Laboratory, Global Monitoring Division and Integrated Surface Hourly (NOAA ISH) are the sources of the data.
Contribution
Contributions to this package are welcome. The preferred method of contribution is through a GitHub pull request. Feel also free to contact us by creating an issue.
Citation
To cite the climate package in publications, please use this paper:
Czernecki, B.; Głogowski, A.; Nowosad, J. Climate: An R Package to Access Free In-Situ Meteorological and Hydrological Datasets for Environmental Assessment. Sustainability 2020, 12, 394. https://doi.org/10.3390/su12010394”
LaTeX/BibTeX version can be obtained with:
library(climate)
citation("climate")

