Introduction to the climate package
Bartosz Czernecki, Arkadiusz Głogowski, Jakub Nowosad
2026-07-13
Source:vignettes/getstarted.Rmd
getstarted.RmdThe goal of the climate R package is to automatize downloading of in-situ meteorological and hydrological data from publicly available repositories:
- OGIMET (ogimet.com) - up-to-date collection of SYNOP dataset
- University of Wyoming - atmospheric vertical profiling data (http://weather.uwyo.edu/upperair/)
- Polish Institute of Meteorology and Water Management - National Research Institute (IMGW-PIB)
- National Oceanic & Atmospheric Administration - Earth System Research Laboratories - Global Monitoring Laboratory (NOAA)
- National Centers for Environmental Information, National Oceanic & Atmospheric Administration - National Climatic Data Center - Integrated Surface Hourly (ISH) (NOAA)
Functions
Meteorological data
meteo_ogimet() - Downloading hourly and daily meteorological data from the SYNOP stations available in the ogimet.com collection. Any meteorological (aka SYNOP) station working under the World Meteorological Organization (WMO) framework after year 2000 should be accessible. Two backends are available and selected automatically: raw SYNOP decoding (
source = "synop", default forinterval = "hourly") and HTML scraping (source = "html", default forinterval = "daily"). Country-level bulk downloads are supported via thecountry_nameargument (SYNOP backend only).meteo_imgw() - Downloading hourly, daily, and monthly meteorological data from the SYNOP/CLIMATE/PRECIP stations available in the danepubliczne.imgw.pl collection. It is a wrapper for
meteo_monthly(),meteo_daily(),meteo_hourly()andmeteo_imgw_datastore()which gives access from monthly to even 10-min datasets.meteo_noaa_hourly() - Downloading hourly NCEI/NOAA Integrated Surface Hourly (ISH) meteorological data - some stations have > 100 years of observations.
meteo_noaa_co2() - Downloading monthly CO2 measurements from Mauna Loa Observatory.
sounding_wyoming() - Downloading measurements of the vertical profile of atmosphere (aka rawinsonde data).
synop_parser() - Decoding raw FM-12 SYNOP meteorological messages into structured R lists or data frames. For a full walkthrough see the SYNOP Messages vignette.
Hydrological data
hydro_imgw() - Downloading daily and monthly hydrological data from stations available in the danepubliczne.imgw.pl collection. It is a wrapper for
hydro_monthly()andhydro_daily().hydro_imgw_datastore() - Downloading hourly and sub-hourly hydrological data from the IMGW-PIB hydro telemetry stations.
Auxiliary functions and datasets
- stations_ogimet() - Downloading information about all stations available in the selected country in the Ogimet repository
- nearest_stations_ogimet() - Downloading information about nearest stations to the selected point using the Ogimet repository
- nearest_stations_noaa() - Downloading information about nearest stations to the selected point in the NOAA ISH meteorological repository
- nearest_stations_imgw() - List of nearby meteorological or hydrological IMGW-PIB stations in Poland
- imgw_meteo_stations - Built-in metadata from the IMGW-PIB repository for meteorological stations, their geographical coordinates, and ID numbers
- imgw_hydro_stations - Built-in metadata from the IMGW-PIB repository for hydrological stations, their geographical coordinates, and ID numbers
- stations_meteo_imgw_telemetry - Downloading complete and up-to-date coordinates for IMGW-PIB telemetry meteorological stations
- stations_hydro_imgw_telemetry - Downloading complete and up-to-date coordinates for IMGW-PIB telemetry hydrological stations
- imgw_meteo_abbrev - Dictionary explaining variables available for meteorological stations (from the IMGW-PIB repository)
- imgw_hydro_abbrev - Dictionary explaining variables available for hydrological stations (from the IMGW-PIB repository)
Examples
Examples shows application of climate package with additional use of tools that help with processing the data to increase legible of downloaded data.
Example 1
Finding a 50 nearest meteorological stations for a given coordinates in a given country(ies):
library(climate)
ns = nearest_stations_ogimet(country = c("United Kingdom"),
                             point = c(-3, 50),
                             no_of_stations = 50,
                             add_map = TRUE)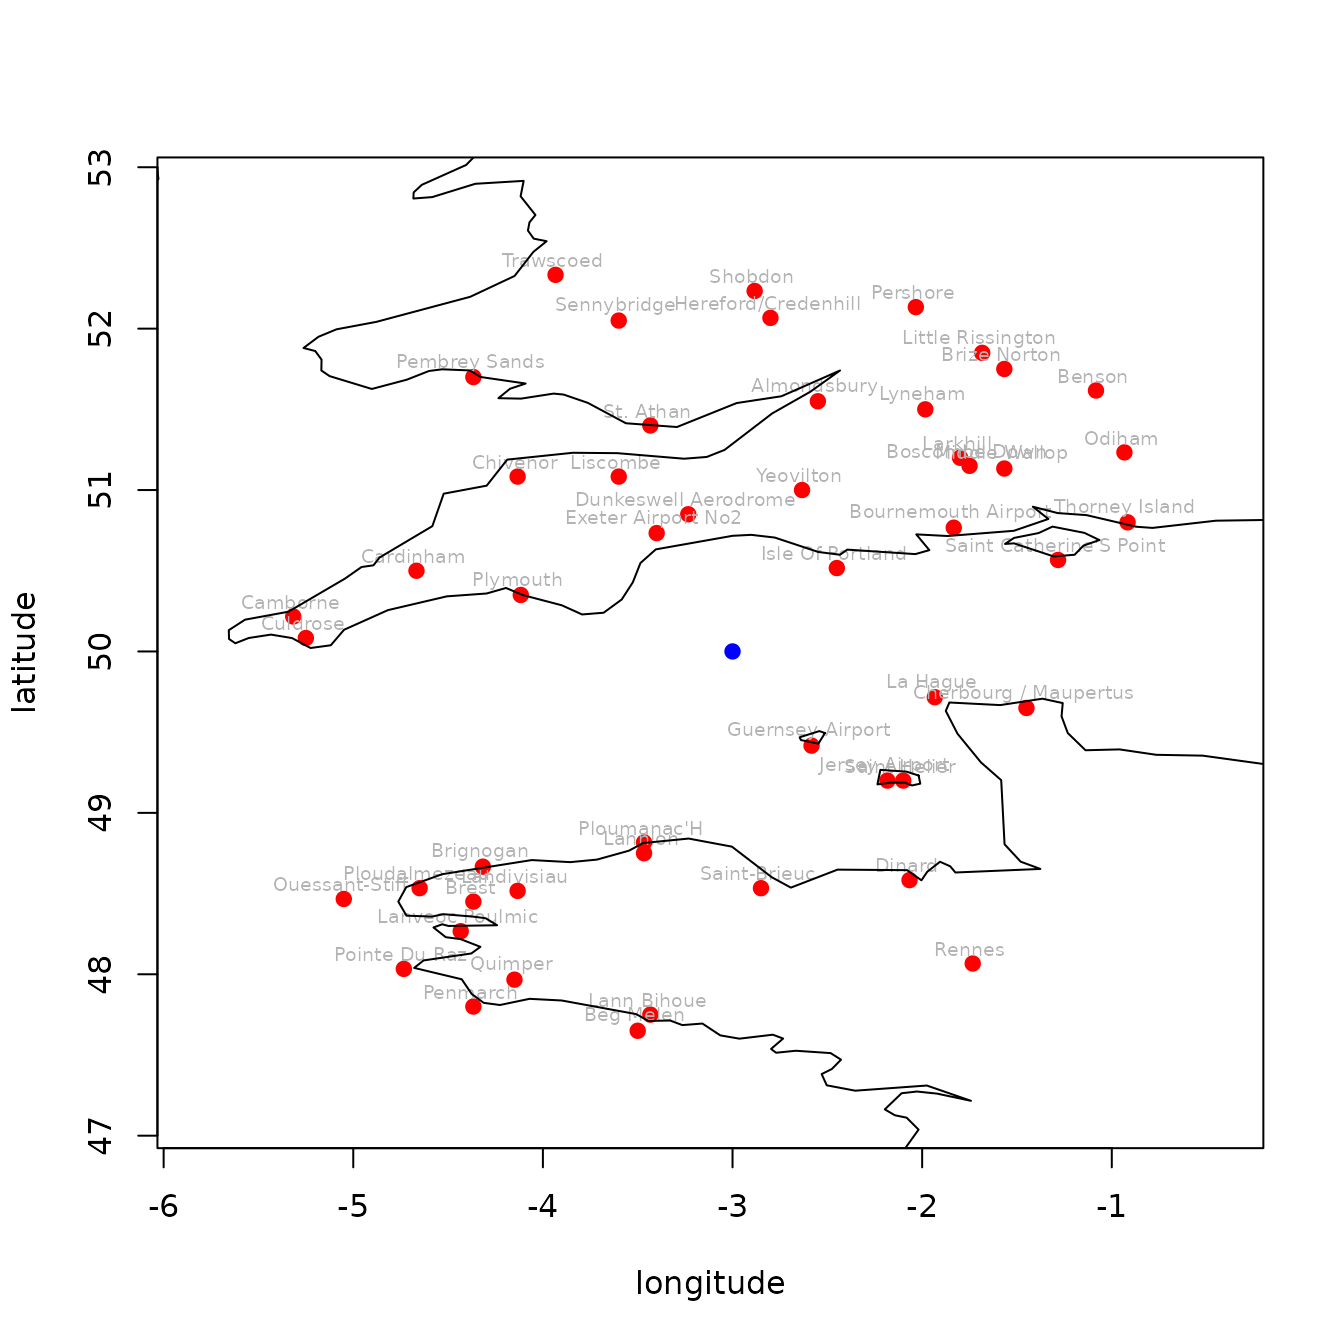
if (is.data.frame(ns)) {
 knitr::kable(head(ns, 15))
}| wmo_id | station_names | lon | lat | alt | distance | |
|---|---|---|---|---|---|---|
| 126 | 03894 | Guernsey Airport | -2.583345 | 49.41667 | 102 | 80.42783 |
| 120 | 03857 | Isle Of Portland | -2.450009 | 50.51668 | 52 | 84.66540 |
| 118 | 03844 | Exeter Airport No2 | -3.400008 | 50.73335 | 31 | 93.72323 |
| 117 | 03840 | Dunkeswell Aerodrome | -3.233338 | 50.85002 | 252 | 98.89712 |
| 119 | 03853 | Yeovilton | -2.633346 | 51.00000 | 23 | 119.50052 |
| 127 | 03895 | Jersey Airport | -2.183337 | 49.20000 | 84 | 128.26450 |
| 116 | 03827 | Plymouth | -4.116669 | 50.35001 | 50 | 131.29669 |
| 128 | 03896 | Saint Helier | -2.100002 | 49.20000 | 54 | 135.10222 |
| 100 | 03710 | Liscombe | -3.600012 | 51.08333 | 348 | 138.94411 |
| 121 | 03862 | Bournemouth Airport | -1.833350 | 50.76668 | 12 | 156.62887 |
| 101 | 03716 | St. Athan | -3.433342 | 51.40001 | 50 | 164.42872 |
| 99 | 03707 | Chivenor | -4.133336 | 51.08333 | 8 | 175.90439 |
| 137 | 03930 | Almondsbury | -2.550011 | 51.55001 | 75 | 181.08641 |
| 103 | 03743 | Larkhill | -1.800016 | 51.20000 | 132 | 190.40311 |
| 104 | 03746 | Boscombe Down | -1.750015 | 51.15000 | 124 | 190.56827 |
Example 2
Summary of stations available in Ogimet repository for a selected country:
library(climate)
PL = stations_ogimet(country = "Poland", add_map = TRUE)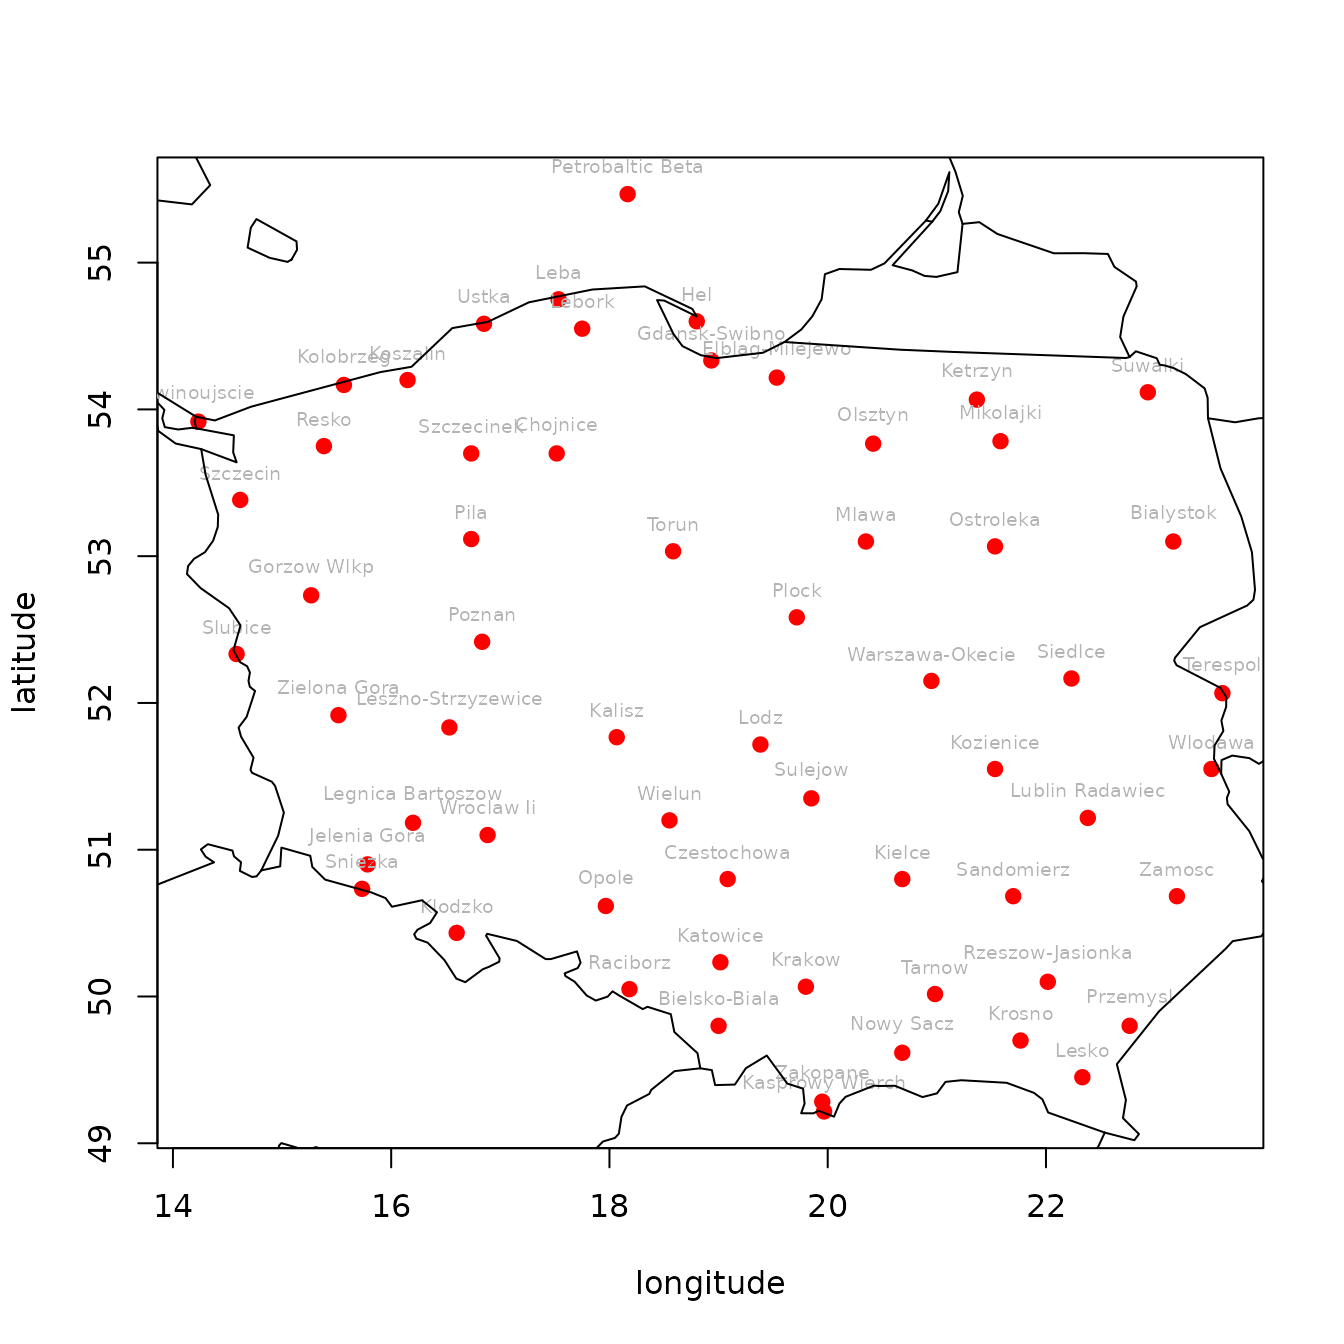
if (is.data.frame(PL)) {
    knitr::kable(head(PL))
}| wmo_id | station_names | lon | lat | alt |
|---|---|---|---|---|
| 12001 | Petrobaltic Beta | 18.16667 | 55.46668 | 46 |
| 12100 | Kolobrzeg | 15.56668 | 54.16667 | 4 |
| 12105 | Koszalin | 16.15000 | 54.20000 | 33 |
| 12115 | Ustka | 16.85002 | 54.58335 | 3 |
| 12120 | Leba | 17.53334 | 54.75001 | 2 |
| 12125 | Lebork | 17.75002 | 54.55001 | 39 |
Example 3
Downlading hourly meteorological data from Svalbard (Norway) for year 2016 using NOAA service
# downloading data with NOAA service:
df = meteo_noaa_hourly(station = "010080-99999", year = 2016)

# You can also download the same (but more granular) data with Ogimet.com (example for year 2016):
# df = meteo_ogimet(interval = "hourly",
#                   date = c("2016-01-01", "2016-12-31"),
# station = "01008")| date | year | month | day | hour | lon | lat | alt | t2m | dpt2m | ws | wd | slp | visibility | |
|---|---|---|---|---|---|---|---|---|---|---|---|---|---|---|
| 1 | 2016-01-01 00:00:00 | 2016 | 1 | 1 | 0 | 15.467 | 78.25 | 29 | 5.0 | -1.6 | 5 | 200 | 1007.5 | 65000 |
| 3 | 2016-01-01 01:00:00 | 2016 | 1 | 1 | 1 | 15.467 | 78.25 | 29 | 5.2 | -1.7 | 3 | 180 | 1008.2 | NA |
| 5 | 2016-01-01 02:00:00 | 2016 | 1 | 1 | 2 | 15.467 | 78.25 | 29 | 4.6 | -1.2 | 6 | 170 | 1008.5 | NA |
| 7 | 2016-01-01 03:00:00 | 2016 | 1 | 1 | 3 | 15.467 | 78.25 | 29 | 4.3 | -0.9 | 5 | 190 | 1008.6 | 70001 |
| 9 | 2016-01-01 04:00:00 | 2016 | 1 | 1 | 4 | 15.467 | 78.25 | 29 | 3.7 | -1.0 | 5 | 160 | 1008.8 | NA |
| 11 | 2016-01-01 05:00:00 | 2016 | 1 | 1 | 5 | 15.467 | 78.25 | 29 | 3.2 | -1.0 | 4 | 150 | 1008.6 | NA |
Example 4
Downloading atmospheric vertical profile (sounding) for Łeba, PL station:
profile_demo = sounding_wyoming(wmo_id = 12120,
                                 yy = 2000,
                                 mm = 3,
                                 dd = 23,
                                 hh = 0)
df2 = profile_demo[[1]]
colnames(df2)[c(1, 3:4)] = c("PRESS", "TEMP", "DEWPT") # changing column names| PRESS | HGHT | TEMP | DEWPT | RELH | MIXR | DRCT | SKNT | THTA | THTE | THTV |
|---|---|---|---|---|---|---|---|---|---|---|
| 1013 | 6 | 4.2 | 3.8 | 97 | 4.98 | 270 | 8 | 276.3 | 290.0 | 277.2 |
| 1009 | 37 | 2.4 | 2.3 | 99 | 4.50 | 285 | 12 | 274.9 | 287.2 | 275.6 |
| 1000 | 107 | 2.2 | 1.9 | 98 | 4.41 | 295 | 17 | 275.4 | 287.5 | 276.1 |
| 976 | 303 | 0.8 | -1.3 | 86 | 3.58 | 298 | 23 | 275.9 | 285.8 | 276.5 |
| 970 | 352 | 1.0 | -6.0 | 60 | 2.53 | 299 | 25 | 276.6 | 283.8 | 277.0 |
| 959 | 444 | 1.0 | -0.6 | 89 | 3.83 | 300 | 27 | 277.4 | 288.2 | 278.1 |
| 925 | 733 | -1.1 | -1.1 | 100 | 3.83 | 290 | 27 | 278.2 | 288.9 | 278.8 |
| 913 | 837 | -1.5 | -1.5 | 100 | 3.76 | 285 | 27 | 278.8 | 289.4 | 279.4 |
| 877 | 1157 | -2.9 | -2.9 | 100 | 3.54 | 288 | 29 | 280.6 | 290.6 | 281.2 |
| 850 | 1404 | -4.1 | -4.1 | 100 | 3.33 | 290 | 31 | 281.8 | 291.4 | 282.4 |
Example 5
Preparing an annual summary of air temperature and precipitation using dplyr syntax for 10-years period (1991-2000)
library(climate)
df = meteo_imgw(interval = "monthly", rank = "synop", year = 1991:2000, station = "ŁEBA")
# please note that sometimes 2 names are used for the same station in different years
suppressMessages(library(dplyr))
df2 = dplyr::select(df, station:t2m_mean_mon, rr_monthly)

monthly_summary = df2 %>%
  dplyr::group_by(mm) %>%
  dplyr::summarise(tmax = mean(tmax_abs, na.rm = TRUE),
                   tmin = mean(tmin_abs, na.rm = TRUE),
                   tavg = mean(t2m_mean_mon, na.rm = TRUE),
                   precip = sum(rr_monthly) / n_distinct(yy))

monthly_summary = as.data.frame(t(monthly_summary[, c(5, 2, 3, 4)]))
monthly_summary = round(monthly_summary, 1)
colnames(monthly_summary) = month.abb| Jan | Feb | Mar | Apr | May | Jun | Jul | Aug | Sep | Oct | Nov | Dec | |
|---|---|---|---|---|---|---|---|---|---|---|---|---|
| precip | 39.0 | 34.6 | 41.0 | 32.1 | 50.5 | 57.5 | 52.7 | 78.5 | 68.9 | 83.8 | 47.9 | 52.0 |
| tmax | 8.1 | 9.1 | 13.6 | 22.6 | 25.6 | 29.6 | 29.6 | 28.5 | 22.7 | 18.4 | 11.6 | 8.8 |
| tmin | -11.6 | -9.6 | -6.3 | -4.1 | 0.0 | 4.5 | 6.4 | 6.7 | 3.0 | -1.6 | -6.0 | -10.4 |
| tavg | 0.5 | 0.7 | 2.7 | 6.8 | 10.6 | 14.4 | 16.9 | 17.0 | 13.2 | 8.8 | 3.7 | 0.9 |
Example 6
Calculate the mean maximum value of the flow on the stations in each
year with dplyr’s summarise(), and spread
data by year using tidyr’s spread() to get
the annual means of maximum flow in the consecutive columns.
library(climate)
library(dplyr)
library(tidyr)
h = hydro_imgw(interval = "monthly", year = 2001:2002)| id | X | Y | station | riv_or_lake | hyy | idhyy | idex | H | Q | T | mm | |
|---|---|---|---|---|---|---|---|---|---|---|---|---|
| 18723 | 150210180 | 21.8335 | 50.88641 | ANNOPOL | Wisła (2) | 2001 | 1 | 1 | 214 | 172 | NA | 11 |
| 18724 | 150210180 | 21.8335 | 50.88641 | ANNOPOL | Wisła (2) | 2001 | 1 | 2 | 228 | 207 | NA | 11 |
| 18725 | 150210180 | 21.8335 | 50.88641 | ANNOPOL | Wisła (2) | 2001 | 1 | 3 | 250 | 272 | NA | 11 |
| 18726 | 150210180 | 21.8335 | 50.88641 | ANNOPOL | Wisła (2) | 2001 | 2 | 1 | 215 | 174 | NA | 12 |
| 18727 | 150210180 | 21.8335 | 50.88641 | ANNOPOL | Wisła (2) | 2001 | 2 | 2 | 225 | 201 | NA | 12 |
| 18728 | 150210180 | 21.8335 | 50.88641 | ANNOPOL | Wisła (2) | 2001 | 2 | 3 | 258 | 297 | NA | 12 |
h2 = h %>%
  dplyr::filter(idex == 3) %>%
  dplyr::select(id, station, X, Y, hyy, Q) %>%
  dplyr::group_by(hyy, id, station, X, Y) %>%
  dplyr::summarise(annual_mean_Q = round(mean(Q, na.rm = TRUE), 1)) %>%
  tidyr::pivot_wider(names_from = hyy, values_from = annual_mean_Q)
#> `summarise()` has regrouped the output.
#> ℹ Summaries were computed grouped by hyy, id, station, X, and Y.
#> ℹ Output is grouped by hyy, id, station, and X.
#> ℹ Use `summarise(.groups = "drop_last")` to silence this message.
#> ℹ Use `summarise(.by = c(hyy, id, station, X, Y))` for per-operation grouping
#>   (`?dplyr::dplyr_by`) instead.

knitr::kable(head(h2))| id | station | X | Y | 2001 | 2002 |
|---|---|---|---|---|---|
| 149180010 | KRZYŻANOWICE | 18.28780 | 49.99301 | 200.5 | 147.4 |
| 149180020 | CHAŁUPKI | 18.32752 | 49.92127 | 174.7 | 96.7 |
| 149180040 | GOŁKOWICE | 18.49640 | 49.92579 | 4.5 | 2.0 |
| 149180050 | ZEBRZYDOWICE | 18.61326 | 49.88025 | 13.5 | 7.9 |
| 149180060 | CIESZYN | 18.62972 | 49.74616 | 57.2 | 57.7 |
| 149180070 | CIESZYN | 18.63137 | 49.74629 | NaN | NaN |
Example 7
Downloading monthly CO2 measurements from Mauna Loa Observatory and plotting the Keeling Curve:
Example 8
Decoding raw SYNOP meteorological messages with synop_parser():
library(climate)

synop_code = "AAXX 01004 88889 12782 61506 10094 20047 30111 40197 53007 60001 81541"

# Decode a single message — returns a named list
result = synop_parser(synop_code)
result$air_temperature$value   # 9.4°C
#> [1] 9.4
result$wind_speed$value        # 6 kt
#> NULL
result$sea_level_pressure$value # 1019.7 hPa
#> [1] 1019.7
# Return a tidy data frame with one row per message
df_parser = synop_parser(synop_code, as_data_frame = TRUE)
knitr::kable(df_parser[, 1:8])| station_type | station_id | region | obs_day | obs_hour | wind_unit | wind_estimated | visibility |
|---|---|---|---|---|---|---|---|
| AAXX | 88889 | III | 1 | 0 | KT | FALSE | 40000 |
Acknowledgment
Ogimet.com, University of Wyoming, and Institute of Meteorology and Water Management - National Research Institute (IMGW-PIB), National Oceanic & Atmospheric Administration (NOAA) - Earth System Research Laboratories - Global Monitoring Laboratory, Global Monitoring Division and Integrated Surface Hourly (NOAA ISH) are the sources of the data.
Contribution
Contributions to this package are welcome. The preferred method of contribution is through a GitHub pull request. Feel also free to contact us by creating an issue.
Citation
To cite the climate package in publications, please use
this paper:
Czernecki, B.; Głogowski, A.; Nowosad, J. Climate: An R Package to Access Free In-Situ Meteorological and Hydrological Datasets for Environmental Assessment. Sustainability 2020, 12, 394. https://doi.org/10.3390/su12010394”
LaTeX version can be obtained with:
library(climate)
citation("climate")